Project
IP Collaboration Candidate Screening
A decision-support prototype that narrows a large pool of character IPs to a per-audience shortlist — separating "generally popular" from "a fit for this segment".
- Role
- Co-creator — Team とあるパンダ
- Period
- 2026
- Status
- Completed
- Stack
- Python · Entropy Balancing · Sparse Group Regularisation · Nested Cross-Validation · Survey Data
What this is
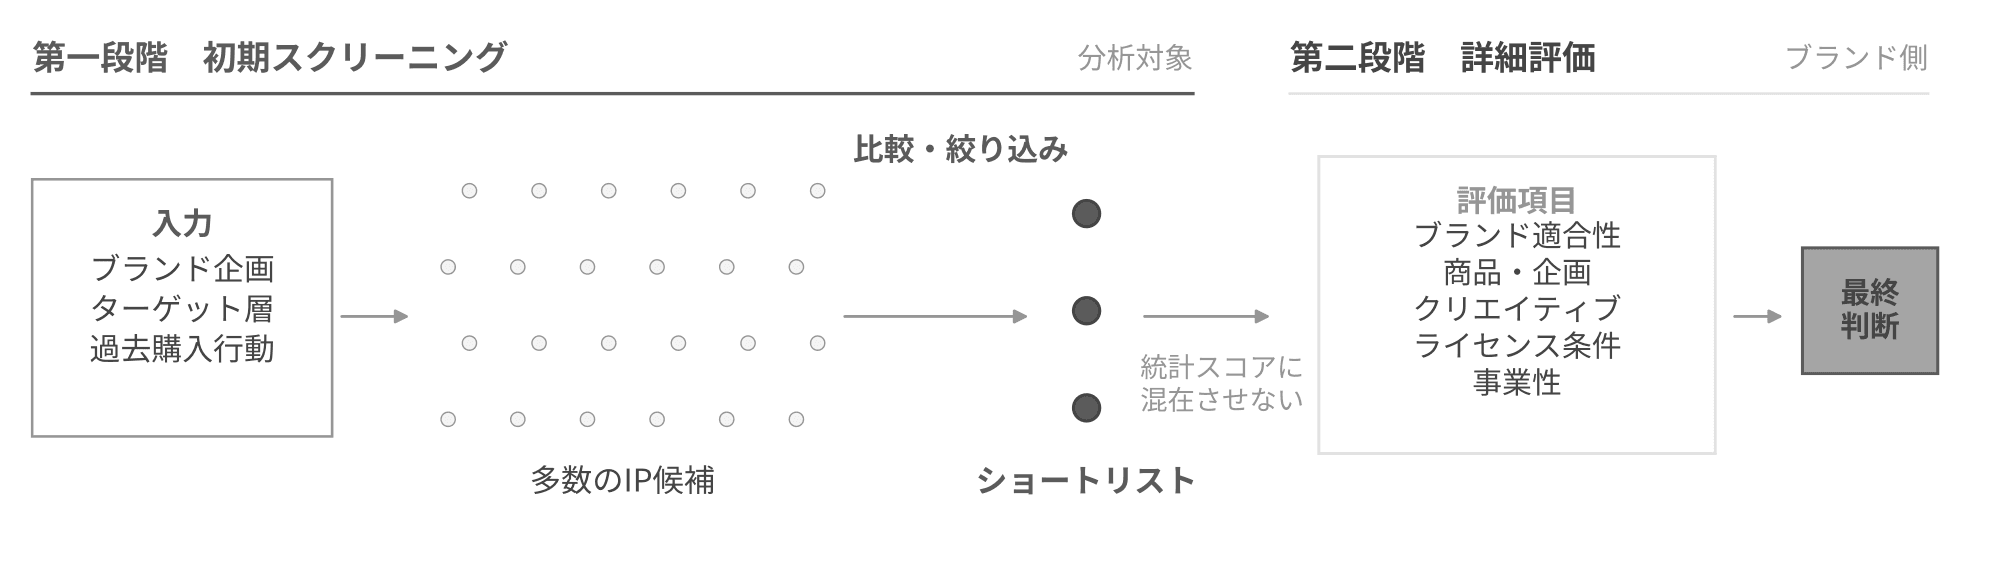
A decision-support prototype for the first stage of brand–IP collaboration: narrowing a large pool of character IPs down to a shortlist worth the cost of investigating properly. Built for the 9th Data Science Contest with Team とあるパンダ, on a commercial consumer survey plus an IP attribute table the team compiled from public sources.
Why popularity is the wrong ranking
Ranking IPs by overall popularity does not answer the question a brand is actually asking. The most popular IP is popular with everyone, which is exactly why it carries no information about a particular audience. So the model separates three layers: how much a given consumer buys in general, how broadly a given IP is bought, and whether a specific consumer–IP pairing has any pull left over once those two are controlled for. Only the third layer speaks to fit.
How it works
Past purchase is decomposed into two cross-sectional states — whether the consumer knows the IP at all, and whether they bought given that they knew it — so that "didn't buy" is never confused with "never heard of it". A brand's target audience arrives as a short list of attributes rather than a full questionnaire, and entropy balancing maps that description onto weighted survey respondents. The system returns three rankings that are deliberately never collapsed into a single score, because scale, relative opportunity and structural fit answer different business questions, and merging them hides the trade-off behind an arbitrary weight.
Validation
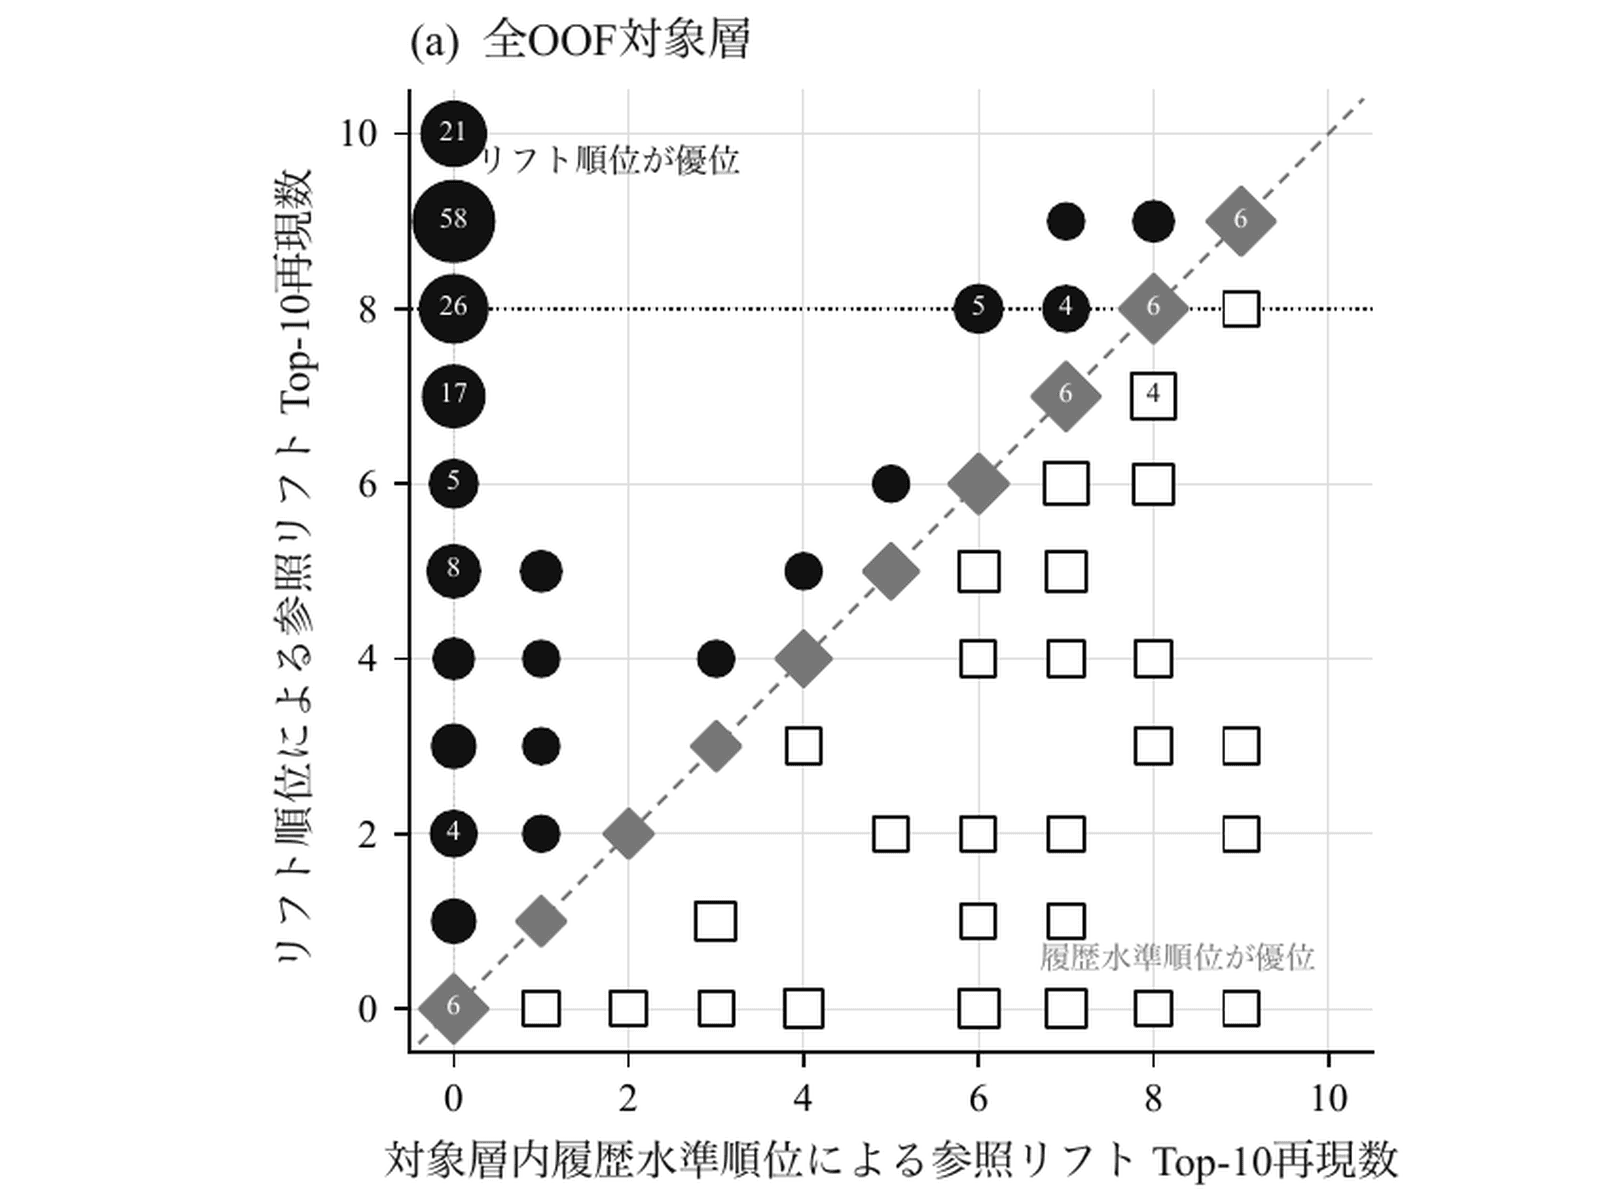
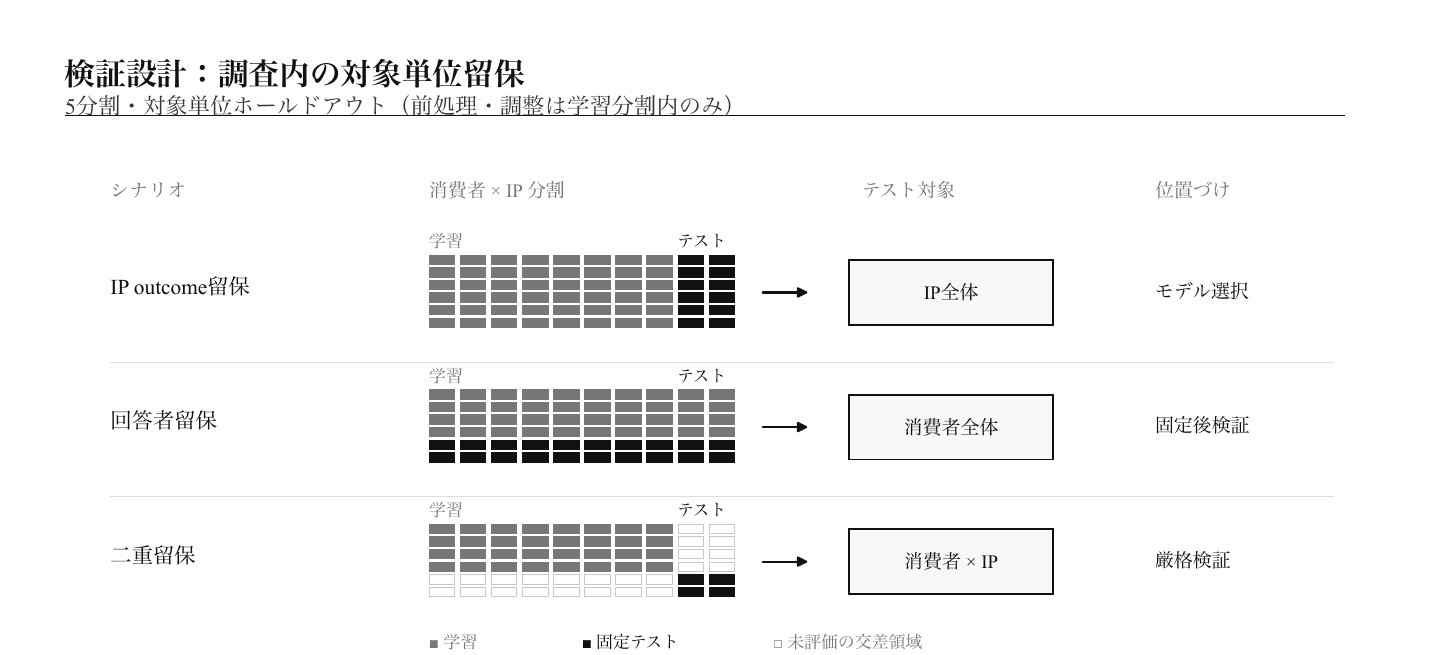
Validation used three hold-out designs — unseen IPs, unseen respondents, and both at once — under nested cross-validation with every preprocessing step confined to the training folds. Adding the consumer–IP matching signal improved out-of-sample prediction consistently across folds, though the gain was modest. The more interesting result was that the two rankings turned out to be non-redundant: the segment-specific ordering recovered most of the reference candidates that the overall-popularity ordering missed entirely. That is the whole argument for building this rather than sorting a table by awareness.
Limitations
The report is blunt about what this is not. It is an analysis prototype validated inside a single survey year — not a production system, not a causal estimate, not a revenue forecast, and not evidence of generalisation to other years, markets, or IPs outside the survey. Only a minority of the tested target descriptions were well enough supported for the system to return a formal ranking at all; for the rest it withholds one by design rather than producing a confident-looking number.
Data availability
The underlying survey data is proprietary to the contest, so this page describes the method and the direction of the findings only — no sample figures, no performance metrics, and no IP-level results.
Where this sits in the portfolio