Product & community case study
CAS 2026 Paper Network
From a flat conference programme to an explorable map of related research.
- Role
- Sole Developer
- Period
- 2026
- Status
- Completed
- Stack
- Python · SPECTER · PCA · NetworkX · Louvain · DeepSeek · Ollama · Three.js
One-line summary
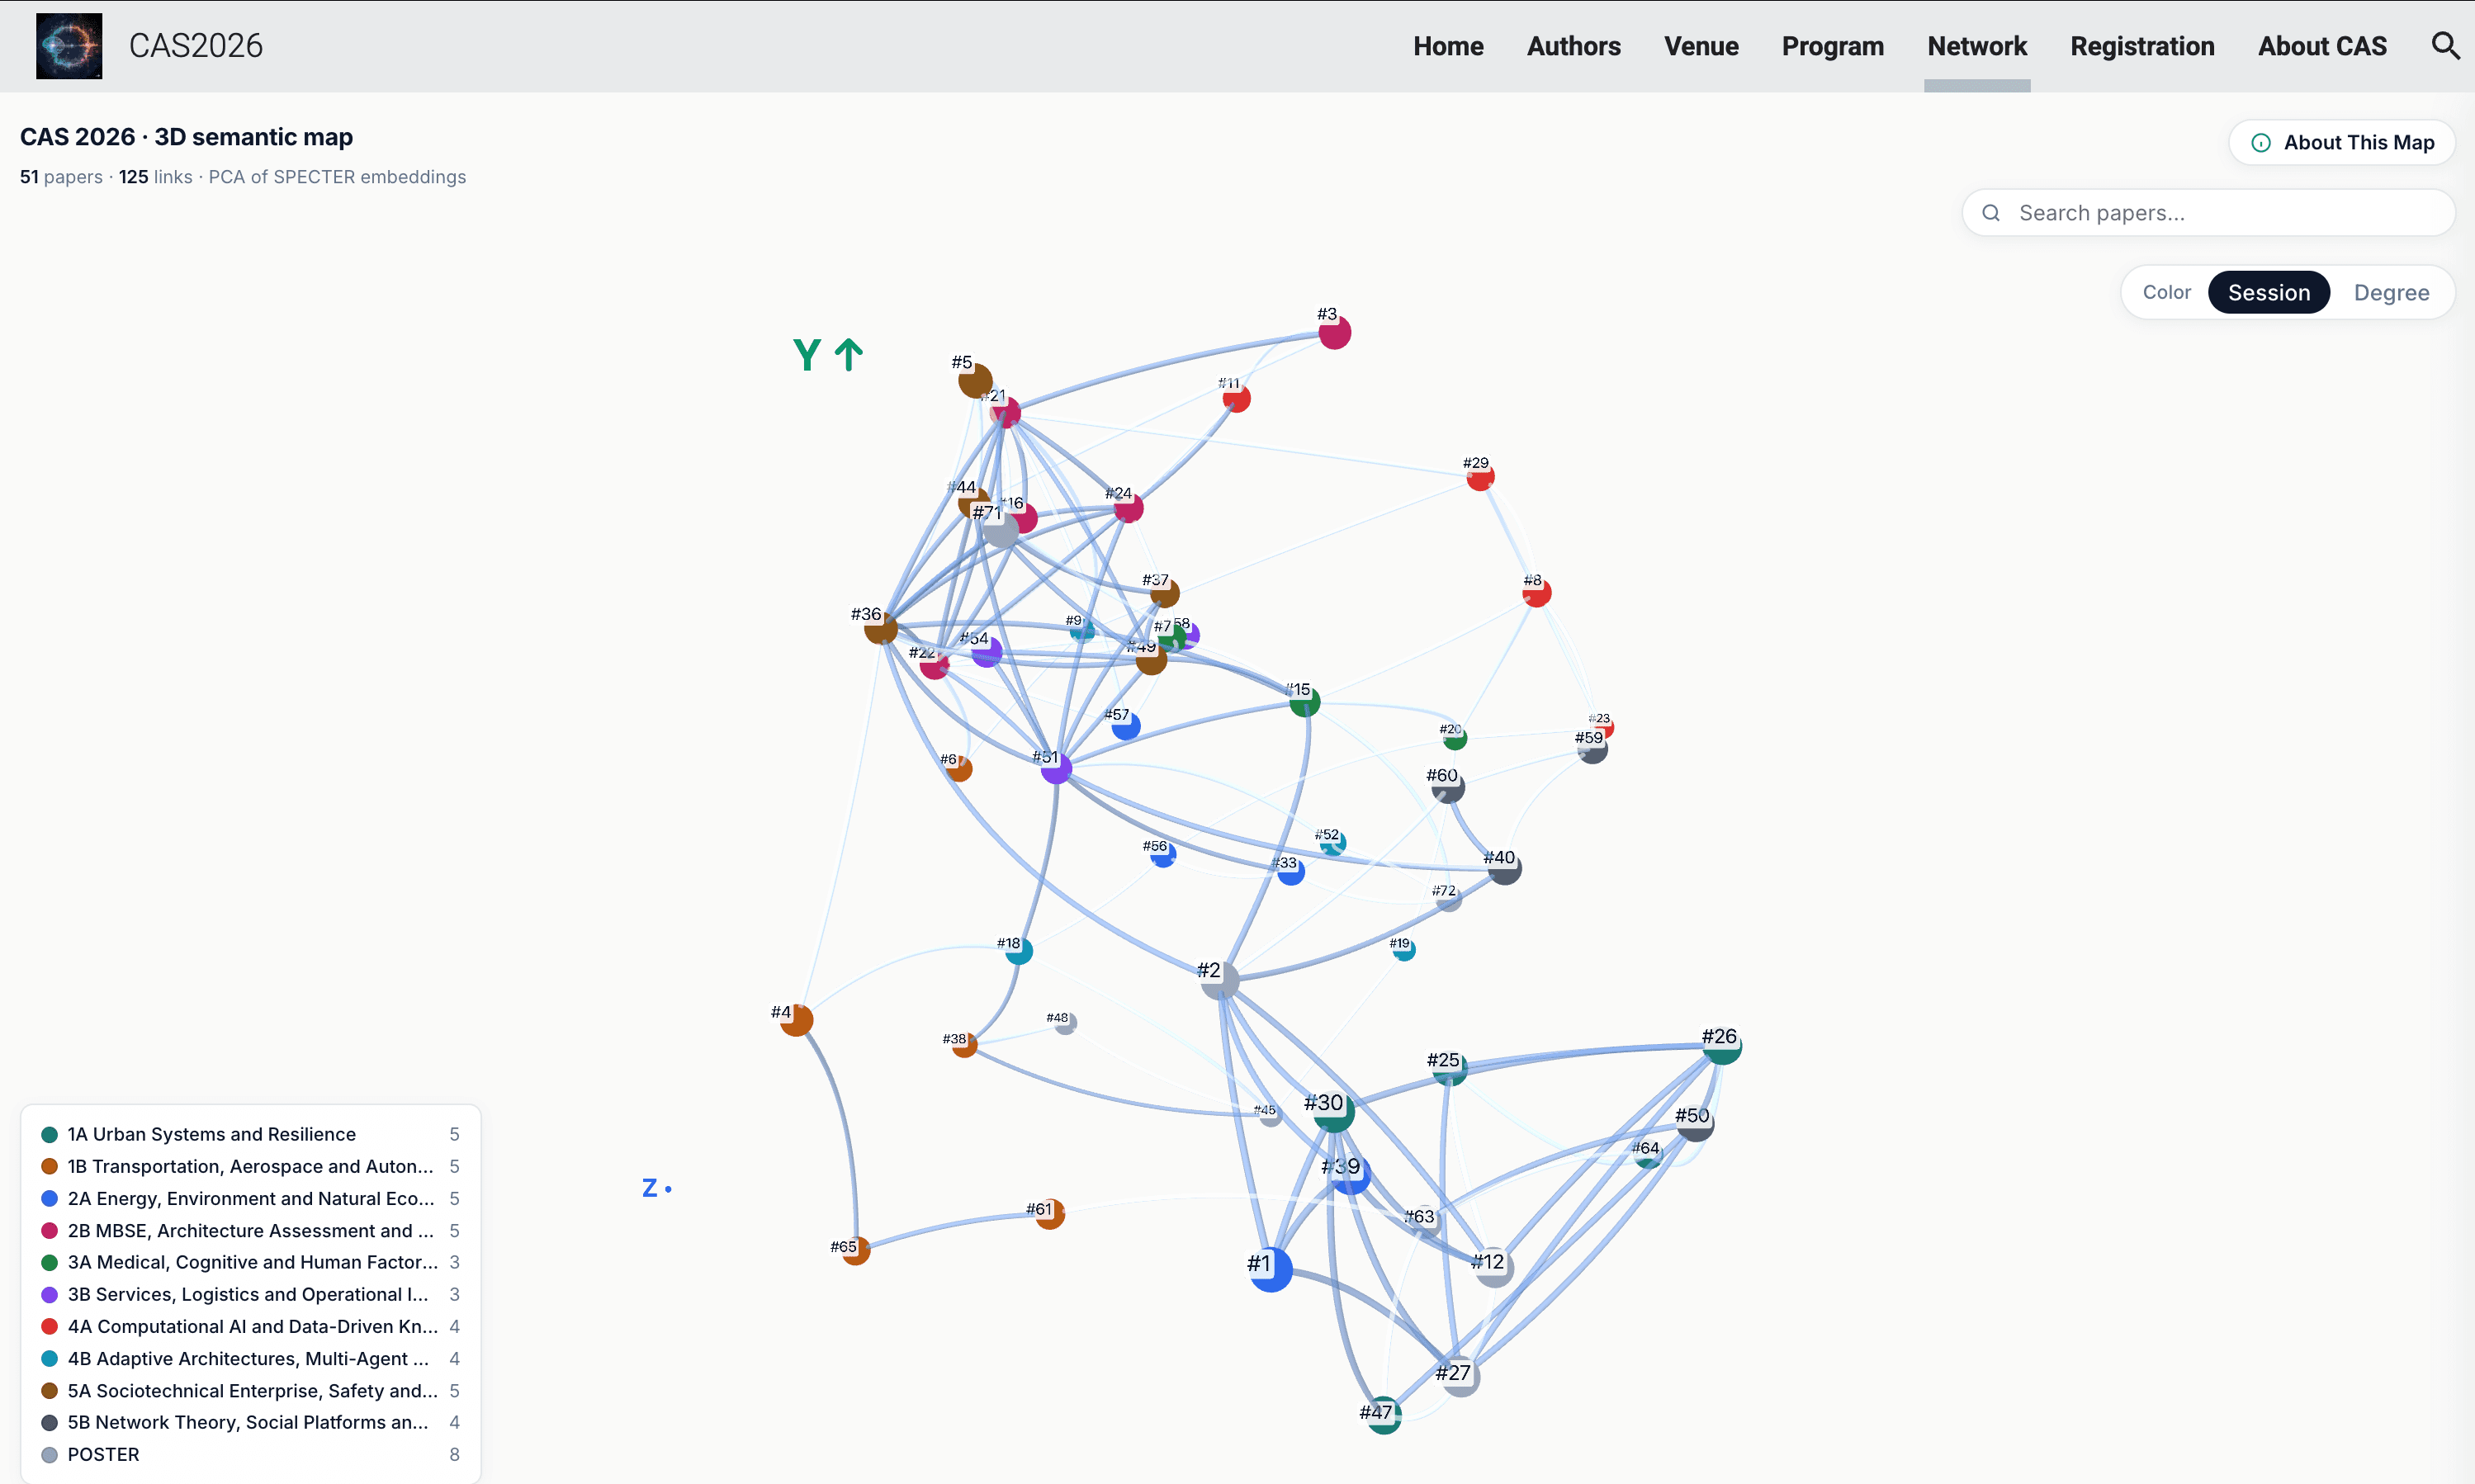
An interactive semantic discovery platform that turns 51 CAS 2026 papers into a navigable 3D network of 125 meaningful research connections.
At a glance
- 01Problem
- A linear conference programme helps with scheduling but makes related work difficult to discover across sessions and research areas.
- 02Context
- The official paper-discovery experience used during CAS 2026 to help attendees explore the conference programme.
- 03My contribution
- Independently designed and developed the complete system in one month, from data ingestion and semantic modelling to interaction design and deployment.
- 04Outcome
- Deployed on the CAS 2026 website and used during the conference, mapping 51 papers through 125 semantic links and receiving positive feedback.
Evidence highlights
- 51
- conference papers mapped
- 125
- semantic relationships
- 1 month
- end-to-end delivery
Accepted and poster papers in the deployed experience
Connections available for cross-topic exploration
Sole development from concept to conference launch
Three-minute walkthrough
Why a flat programme hides useful connections
Conference programmes are organised for scheduling, not discovery. Papers that share a method, domain or scientific mechanism may appear in different sessions, while keyword search misses relationships expressed with different terminology. CAS 2026 needed a way to make the programme explorable without asking organisers to maintain a second manual taxonomy.
Turning every abstract into a position in the map
The pipeline reads the conference spreadsheet, validates the required fields and encodes each paper's title and abstract with SPECTER, a transformer model built for scientific documents. Principal component analysis then projects those semantic representations into three dimensions, giving the interface a stable starting layout in which nearby papers tend to discuss related ideas.
Building a graph with no isolated papers
Pairwise cosine similarity supplies the relationship signal. The graph combines the strongest global connections with per-paper nearest neighbours and automatically increases local coverage until no paper is orphaned. The deployed result contains 51 papers and 125 links: dense enough to expose cross-topic structure without turning the view into an unreadable web.
Making similarity understandable
Louvain community detection groups the graph into research themes. A locally hosted DeepSeek model extracts concepts grounded in each abstract, proposes concise cluster names and explains strong relationships that are not obvious from shared terms alone. The interface therefore shows not only that two papers are close, but also the concept or mechanism connecting them.
Designing for exploration during a conference
Attendees can rotate and zoom the 3D map, search for a paper, switch between topic and connectivity views, and open a detail panel with its authors, abstract, concepts and related work. The experience was delivered as a shareable browser page and linked from the official CAS 2026 website, so it could be opened directly during the event.
From concept to conference launch in one month
I independently designed and developed the full product: ingestion, embedding and caching, graph construction, community detection, grounded LLM prompts, the interactive interface and deployment. The system was used during CAS 2026 and received positive feedback. No attendance analytics or quantified engagement study was collected, so the evidence here is the delivered system, its verified scale and its real conference use rather than an invented adoption metric.